2022 Team Defense Strategy Guide
We put a lot of time, effort and argument into the projections that power our fantasy football rankings. So they are definitely worth your time and attention as you prepare for and execute your draft.
At least, that’s true everywhere except team defense.
It’s not that we don’t put the time into those numbers. And just like at every other position, we project full-season numbers that determine the rankings.
The difference is that D/ST weekly results will depend even more on matchups – as well as some fluky turnovers – which is why so many of us now prefer to stream the position instead of choosing 1 “good” defense to start all year.
The Tampa Bay Buccaneers, for example, checked in tops in our full-season numbers (by a little). But they start the year with road trips to Dallas and New Orleans, and then home games vs. Green Bay and Kansas City.
That doesn’t look like an optimal start for a fantasy defense. Frankly, I wouldn’t be shocked if the Detroit Lions defense finishes Week 4 with more total fantasy points than Tampa’s.
We’ll get to the details on that front. But first, let’s back up and look at the method.
Finding the Right Opponents
I looked back over NFL.com’s fantasy points “allowed” numbers for team defenses, which date back to 2010. I lined up those 12 seasons of average fantasy points, got the median for each spot in the rankings and compared it to the overall median score. Here are the resulting impacts:

The green section represents the 8 spots that have added 20+% to team-D scoring – the friendliest matchups.
The red section represents the 9 matchup spots that have taken 20+% of the fantasy scoring away from team defenses.
In between sit the more neutral matchups. We’ll use this breakdown to help us separate the expected matchup groups for 2022 later in this article.
The Stats
I’ve checked over several seasons now to see what most drives in-season fantasy scoring for team defenses and what might signal the next year’s matchups. And each time, my results have come up similar.
Results can differ by scoring system. But for the most familiar D/ST scoring setup, opponent points scored has correlated most closely to a defense’s fantasy-point total.
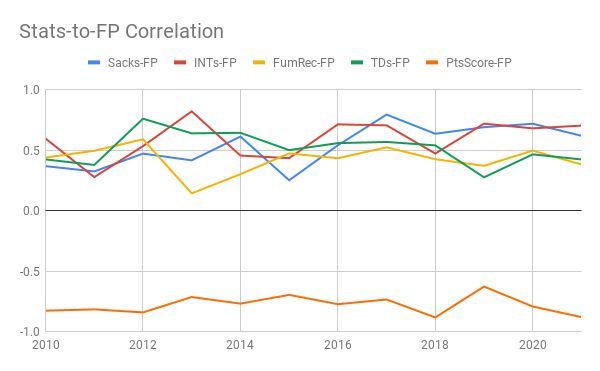
The orange line in that chart represents opponent scoring. It stands alone in negative territory because the correlation runs opposite to the other stat categories. The fewer points an opponent scores, the more fantasy points your defense gets. For every other category, of course, the more supplied the better for your defense’s scoring.
Since 2010, the numbers show a -0.784 median correlation between opponent points scored and team-D fantasy scoring. Here’s what those numbers look like for the other categories:
INTs: 0.639
Sacks: 0.577
Defensive TDs: 0.520
Fumble recoveries: 0.436
We’ve seen steady increases in the correlation for sacks to fantasy scoring since 2017 (median 0.690 over that span) and INTs since 2016 (0.705). Yet even over that span, opponent points still checks in stronger (-0.794).
We will certainly be keeping sacks and INTs in mind as we consider team defenses week to week for the coming season. But there’s 1 more reason for us to look primarily at points scored for guiding matchup expectations.
All of these stat categories fluctuate year to year. But among them, offensive points scored has been stickiest year to year.
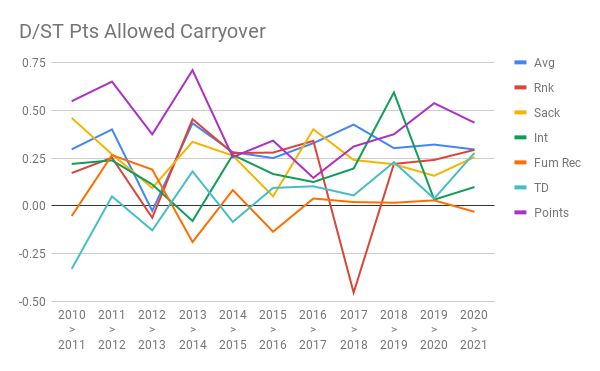
As you can see, the purple line (offensive points) hasn’t always led in highest year-to-year correlation over the reviewed span. But it lives a lot higher in the chart than the rest of them.
To put it another way, an offense’s prior-year performance in scoring gives us more of a signal for what’s coming next season than any of the other categories.
Now let’s get to what we all really came here for and see about the matchups for 2022.
Projecting the Matchups
I looked at offensive scoring from last season, as well as combos of the past 2 seasons and the past 3. I also factored in Vegas projected win totals (from Vegas Insider) to account for 2022 team expectations. And finally, a few teams might have crept into or out of a certain range based on specific offensive changes.
I followed the totals of 8 (positive matchups), 9 (negative) and 14 neutral from the earlier chart. We could quibble over where “positive” and “negative” territory should truly begin. But we’ll also see a number of these matchups change vs. our preseason expectation. So these seem like fair buckets for us to start with.
Here’s how I split the teams as matchups for our D/STs …