The Database: the fuel that gets us where we want to go
Updated 9/28/20 by Jason Phelps
To accomplish our mission of predicting injuries, we need to start with robust injury data. Any attempt to predict injuries will be garbage if your input information is garbage.
The Sports Injury Predictor staff has spent the past year building up an already rich database of injuries and refining our processes for tracking those ailments in order to better project their future impacts.
The result: a database of hundreds of NFL players with injury histories dating back to college.
It all started with hours spent manually poring over years of injury reports. We looked beyond the pathetic excuse for a “report” that the league officially puts out every week. You can’t learn much from a player name and a body part in parentheses, and we all know about league-wide issues with inconsistent injury reporting.
Sure, it’s heroic that Tom Brady has battled through that tragic shoulder injury he suffered while sliding out of the birth canal. But including it on every week’s injury report doesn’t tell us anything. We’d be much more interested, on the other hand, to find out how many of the concussions Dr. Gisele reported actually occurred.
Some situations proved easier to discern than others, but we tracked down as many publicly available details as possible, including news reports from team, local and national sources. (We don’t have access to private medical records which are protected by privacy laws or inside info from NFL team doctors.) And we’ll continue doing so for all reported injuries to fantasy-relevant NFL players – on both sides of the ball – going forward.
We wanted to add “fantasy relevant” players to the data because they are the population who are most important to predict and they get enough media attention to have reliable injury reporting. As of August 2017, we have vetted a combined 611 offensive and defensive players. The offensive players played between 2012 and 2016 and in some season in their careers averaged at least 16 touches per game for QBs, 4.5 for RBs, 1.6 for TEs and 2 for WRs. The 611 players are not exhaustive of these criteria, but are representative. The IDP players were selected based on a top-40 fantasy performance somewhere between 2014-2016.
College injuries prove trickier. The NCAA and member conferences don’t compel schools to report even to the inconsistent level that NFL teams do. But you’ll still find a number of them included in the database.
For every tracked injury, the SIP database includes details such as:
- Injury date
- Time missed (games – even quarters)
- Specific location, nature (pull, sprain, etc.) and severity of the injury (e.g. Grade 1, 2, etc.)
- Whether the player re-aggravated the injury or suffered related issues
- Whether the injury required surgery
- Whether it landed him on IR To date we have vetted 611 players; tracked down and verified all the public details. That group has produced 3,165 total injuries.
Here’s a look at how those records spread out across positions:
- Wide receiver: 151
- Running back: 122
- Quarterback: 58
- Tight end: 58
- Linebacker: 92
- Defensive back: 72
- Defensive lineman: 58
We also drew on the expertise of Jeremy Funk, a clinical epidemiologist and contributor for DynastyLeagueFootball.com. His consultation helped us to define:
143 distinct injuries based on body part, site, condition, grade
- 6 different injury classes
- 27 different conditions
- 13 different body parts
- 61 different body sites
The 6 injury classes break down like this:
- Soft tissue: 1,605 entries
- Internal: 485
- Joint: 458
- Bone: 396
- Cartilage: 44
- Unspecified: 177
The 13 body parts, in order of injury frequency according to our data:
- Pedal (foot): 636 entries
- Knee: 532
- Thigh: 479
- Head: 443
- Shoulder: 253
- Inguinal (groin): 186
- Hand: 155
- Leg: 139
- Chest: 125
- Back: 71
- Arm: 68
- Cervical (neck): 57
- Abdomen: 21
The following sites have proven to be the most commonly affected by injuries in the data we’ve collected so far:
- Hamstring: 465 entries
- Cranial (including concussions): 433
- Ankle: 379
- Foot: 140
- MCL: 136
- Groin: 129
- ACL: 122
- A/C joint (shoulder): 109
- Rib: 95
- Calf: 72
And here are the top conditions that football observers (including fantasy players) can expect to occur:
- Sprain or pull (varying grades): 1,191 entries
- Concussion: 424
- Strain: 419
- Tear: 350
- Fracture: 331
- Bruise: 107
- Dislocation: 80
- Turf toe: 33
And you’ll find still others listed as “unspecified” to cover injuries that don’t fit neatly into our spectrum of categories.
As we move forward, an ever-richer database of injury data will only give us more to work with. We’ll continue to add as more injuries occur around the league throughout the season. Our list of vetted players will continue to grow as will the details we track. And along the way, we’d welcome your submission of any previous injuries you find missing from our database.
Evaluating Our “Chance of Injury” and “Games Missed” Models
Updated 9/28/20 by Jason Phelps
In the summer of 1654, two leading French mathematicians wrote heatedly back and forth debating whether humans possessed the ability to predict the future. At the time, a central mental hurdle was yet to be cleared: God. For centuries, the common belief had been that the future was the realm of the divine and mortals had no hope of projecting it.
One of those mathematicians cleared that hurdle. Within decades, his breakthrough led to the the foundation of modern probability theory, the creation of mortality tables, a flourishing life insurance industry in Europe and a fundamental shift in the collective thinking on quantifying the future.
Flash forward over 350 years and researchers are now just scratching the surface of player monitoring and injury prevention and are arguably still in the dark ages of injury prediction. Just look at the last few years of presentation lineups at the annual Sloan Sports Analytics Conference, a leading forum for sports industry professionals.
The football community largely has a hurdle we are yet to overcome regarding player injuries. It’s not (probably) as ingrained in society as God, but it is there: skepticism. Most believe injuries are random and can’t be predicted. Despite that, everyone from NFL owners to general managers to coaches to trainers to agents, bookies, bettors and fantasy players have vested interest in clearing that hurdle.
Could the mortality tables tell you how or on what day you would die? Nope.But they could give you a pretty good idea of how long you would live.
Can you predict what a player’s next injury will be or on which play it will occur? Maybe with the player tracking data teams are now generating.
Can we predict with some confidence using the public information at hand whether a player will get injured in the coming season, or how many games a player will miss? You bet.
And if you have better predictions than the crowd, if your predictions are better than just random guesses, then your bets will pay off.
Of course, you can make predictions, but you will undoubtedly have errors. What we care about is how close our predictions are to reality. And determining whether one prediction is better than another.
As a fantasy football community, we understand how hard it is to make player projections. Yet, we accept that despite some uncertainty, projections hold value. Fantasy Football Analytics has done some nice work looking at performance prediction accuracy. They’ve shown that we are comfortable with preseason projections that capture little more than half the variation in how the season actually plays out (R-squared values of 0.5-0.6). This is a pretty low threshold for satisfaction, but probably optimistic for the complexity of injury prediction. Significantly proving non-randomness would be a strong step.
Skepticism over the ability to predict player injury is rampant in the football community.And we readily admit that the skepticism is founded. It is a hard nut to crack. No one has done it well… yet.
Part of the issue is the difficulty in wrapping our minds around the feasibility of injury prediction. So, let’s run through a thought exercise. I’ll ask you a few questions and you see what comes to mind.
Which position experiences the injuries most frequently?
Based on the increasing popularity of the Zero-RB drafting strategy, it seems readily accepted that RBs get injured more frequently than WRs. Historical rates from the Sports Injury Predictor database and various industry and academic research have supported this and the fact RBs are more susceptible to injury than any other position. Below are in-season injury rates and average games missed by position for SIP vetted players prior to 2016.
Table 1: In-Season Injury Rates and Games Missed by Position for SIP vetted player seasons prior to 2016

Ok here’s another: Who would you expect to miss more games this season: Eli Manning or Ben Roethlisberger? How about Rob Gronkowski or Jason Witten?
You probably said Big Ben and Gronk. Eli is a notorious iron man, having played in 199 consecutive games.Roethlisberger, on the other hand, has missed games due to injury in 3 of the last 5 seasons. Gronk has averaged 3.7 games missed over his career versus Witten who hasn’t missed a game since the Bush administration.
So, the potential for predictive information is there.But what is the signal and what is the noise?
The Sports Injury Predictor team realizes that without transparency the general skepticism held for injury prediction will be held for our product, as well.
Before we can assess our models we need to set some quantifiable benchmarks. Without context, numbers are fairly meaningless.
Take player A and player B. Player A has a success rate of 32.6% and Player B has a success rate of 71%. Who is better?
Player A.
Why? He is Bryce Harper batting .326 as of August 9th, good for 5th overall in the majors. Player B is Roberto Aguayo, who in 2016 had the worst field goal percentage of any NFL kicker with 25 or more attempts and has already been dumped by his team after being drafted in the 2nd round a year ago.
With this in mind, we are trying to build two signature models that answer the burning questions for preseason decision makers and to properly evaluate them against reasonable alternatives. One model will project the chance of injury in the coming season and the other will predict the number of games missed.
Chance of In-season Injury
How do we set a benchmark for a chance of injury prediction model? Defining an in-season injury as an injury resulting in at least half a game missed, we can start with a few over-simplified prediction models, then score each model using traditional model scoring techniques.
There are many metrics that can be used to judge the quality of predictions, each having their strengths and weaknesses. Accuracy is a standard measure in a problem where you are trying to predict a specific outcome, like sustaining an injury or not. Because we are judging our model’s ability to produce probabilities of injury, log-loss and area under the ROC curve will also be useful quality metrics with which to compare our models.
Accuracy is simply the ratio of true predictions to the total number of predictions. For the calculation we’ll use a standard 50% predicted chance of injury as our cutoff for whether we predict an injury or not. Over 50%, we predict an injury and under we predict a healthy season. This common, but overused metric ignores the confidence in any one prediction. It probably goes without saying, but higher accuracies are better.
Log-loss is used in the annual Kaggle March Madness competition which requires you to give the win probabilities for every possible tourney matchup. Most of us are familiar with filling out brackets and how hard it is to nail a perfect bracket. Log loss essentially strongly penalizes highly confident but wrong predictions. In the March Madness competition, it destroys any entries which guarantee a particular win and get it wrong. Likewise, it discourages our models from guaranteeing or not whether a player will get injured. Lower log loss scores are better.
Area under the ROC curve (ROC-AUC) measures the ability of a model to correctly classify a case as positive or negative (in our case this is whether a player will be injured or not) by comparing true and false positive rates. Scores range from 0.5 being worthless to 1 being an errorless model.A rough guide for evaluating the scores is as follows:
- 0.9-1 Excellent
- 0.8-0.9 Good
- 0.7-0.8 Fair
- 0.6-0.7 Poor
- 0.5-0.6 Terrible
I’ll leave it to you to research these quality metrics any further.
Now that we have some way to objectively quantify the quality of our benchmarks and SIP model, we can consider some simplified chance of injury models. One basic mode model would assign a 0% chance for an in-season injury to all players since most players don’t experience an in-season injury (only 32% of SIP vetted player seasons). Another basic average model would assign the historical average of 32% to all players.
Now, we know those aren’t fair because of the differences in positional injury rates. So, we can make a simple model using the positional averages from Table 1 as well.
Eli vs Big Ben and Witten vs. Gronk suggest that positional averages may not be fair either. So, we also create a player-specific model based on their career in-season injury rate. These become the benchmarks we’ll use to judge our model.
A conversation about our model has to start with the data. In search of signals, we looked at:
- Individual injury histories from the Sports Injury Predictor (SIP) database, including:
- Total accumulated injuries of each type and category
- Days elapsed between September 1st and the last of each type of injury/category
- Durability and susceptibility scores as defined by our clinical epidemiologist, Jeremy Funk
- Injuries and games missed per 100 opportunities and career and positional games missed rates
- Past and future player usage, athletic profiles, position and field surfaces sourced from ArmchairAnalysis.com
- ADP from MyFantasyLeague.com
- Player Projections from DraftSharks.com
All told, nearly 300 variables for almost 3,500 player seasons were evaluated as inputs into various machine learning modeling algorithms. A good model-building process will hide some data from the model until it has been trained. Player seasons prior to 2016 for players whose injury histories were vetted by the SIP team were used to train our models. To test the actual performance of the models, we used 385 player seasons from 2016. Admittedly, it is only one year of data, but to avoid overselling the ability of our model, we used 2016 preseason projections provided by DraftSharks.com instead of a player’s actual usage. This should give us a good approximation as to how well our models will perform in the coming 2017 NFL season.
Table 2: Chance of In-Season Injury Model Comparison on out of sample 2016 data
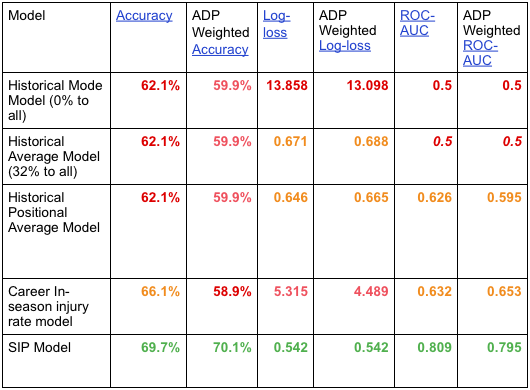
First, let’s point out that the SIP model led the way in all the quality metrics But, we’ll come back to that. Our benchmarks deserve their due.
We can see in Table 1 that the accuracy is static across our first 3 benchmark models. Why? Our cutoff is 50% for an expected injury and those 3 benchmark models don’t actually assign a 50% injury probability to any player. RBs in the positional average model are close at 47.1%, but that only counts in horseshoes and hand grenades. So, every black and white prediction from these benchmark models is that a player will not get injured. Boring.
The career in-season injury rate model does noticeably better on the accuracy than the other 3 benchmarks, but is actually worse when regarding the cost of the player.
Table 1 also shows that the log loss is greatly penalizing the historical mode and career in-season injury rate models (which are terrible in comparison to the other models) for all the cases in which they “guarantee” an outcome but a player actually experiences the opposite. The constant predictions of both the historical mode and historical average models are useless in the eyes of the ROC-AUC score.
The historical positional average model shows some marginal improvement in log loss (from 0.671 to 0.646) and ROC-AUC (from a terrible 0.5 to a poor 0.626). With no major red flags across the quality metrics, this model has some merit. What does that mean? It’s fair to assume a player’s position is suggestive of his injury likelihood, but there is plenty more of the story not being told.
That brings us to the Sports Injury Predictor chance of in-season injury model. The log loss makes a significant improvement over the positional average model (from 0.646 to 0.542). While the ROC-AUC moves from a poor 0.626 to a borderline good 0.809! The accuracy also bests the closest benchmark by 3.5% and by more than 10% for the player cost weighted measure!
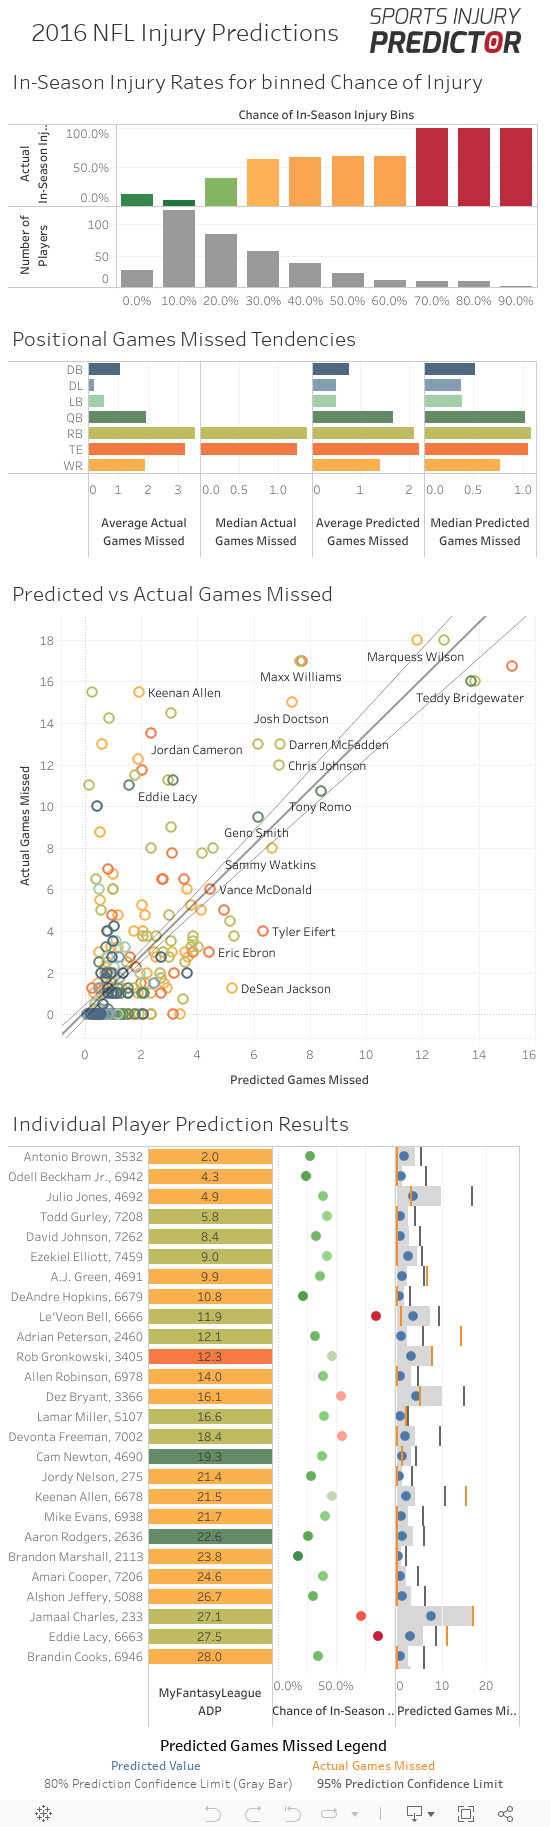
At a more granular and perhaps more conceivable level, we can look at our predictions in groups and compare them to actual rates of injury. If we bin our prediction probabilities in 10% buckets, we can compare the group to the rate of actual in-season injury for the group.
Image 1 below shows that the higher our predicted probability of injury the higher the actual rate of injury for the group is. The increase isn’t perfect step to step, suggesting the model is overly precise, but there are definitely a couple of thresholds with which to pay significant attention: at 30% and 70%. Below 30% a player is relatively safe, above and you can expect an injury. And above 70% an injury is nearly certain.
Image 1: In-Season Injury Rates for binned Chance of Injury

Now arguably, not every prediction is as important. Both teams and fantasy players are far more concerned with players who represent larger investments. Whether that is judged by their annual salaries or fantasy draft position.
So, one thing we considered while building and evaluating our models was how strong our predictions were for those high-cost assets. Using average draft position (ADP) to weight our quality metrics towards the more costly assets, Table 1 shows that it seems a bit more difficult to predict those players with higher ADPs, but that the results are comparable to the unweighted assessment.
Predicted Games Missed
Having a better idea of the chance of injury is all well and good -- and certainly is an improvement over the competition. However, this doesn’t tell us whether the player is likely to miss a game with a concussion or 10 games with an ACL tear. It just gives you an idea of how likely you, as a decision-maker, are to experience an injury headache.
To fill that gap, we also developed a projected games missed model. This is a particularly tricky problem since most of the players didn’t experience an injury in a given season and injuries like ACL tears in week 1 result in a far different number of missed games than an ACL tear in week 12.
So, going into the modeling we are expecting relatively significant errors in our predictions. What we should be focused on again is how our model stands up to some benchmarks. Our oversimplified models based on SIP vetted players will include:
- Historical Mode/Median - predicting all players miss the Mode and Median number of games: 0
- Historical Average - predicting all players miss the average number of games: 1.68
- Historical Positional Average - predicting all players of a given position miss the same number of games (see Table 1)
- Career Average Games Missed - using a player’s career games missed rate times 16
To vet these models, we need to use different metrics than with the chance of injury model since our goal now is to predict a continuous value rather than a probability of occurrence. We will use the following (also comparing the ADP weighted values as before):
- Coefficient of determination (R2)- The proportion of the variance in the actual target values that is predictable with the inputs to the model
- The metric has a maximum of 1, representing a perfect model
- Negative values express that the mean of the actual target values provides a better fit to the actual outcomes than the model itself
- Root Mean Squared Error (RMSE) - Represents the sample standard deviation of the prediction errors (i.e. differences between predicted values and observed values)
- Heavily influenced by large errors
- Mean Absolute Error (MAE) - Average of the absolute prediction error
- Less influenced by large errors
Table 2: Predicted Games Missed Model Comparison on out of sample 2016 data

The SIP model again makes marked improvements over the baseline models.
The R2 value jumps from a benchmark best of 0.026 to 0.401, which means the model inputs can explain 40.1% (Table 2) of the variance in the actual games missed by players fitting similar profiles to those vetted in the SIP database. (40.1% is pretty damn good considering we use player projections that aren’t much better and when most of the public is working with at best 2.6% of the variation!)
The ADP adjusted value isn’t as good, which means it’s harder to predict the high-cost players (mostly due to usage difference, as we’ll see later).But it is still ten times that of the positional average model!
Because of the fact that some players will suffer severe injuries and miss a large number of games, the potential for large errors is pretty high in this endeavor. So, MAE is probably a more appropriate measure of accuracy than RMSE. There is still some uncertainty here in that the mean absolute error is 1.610; meaning, on average, our predictions are off by about a game and a half. In Table 2 we can see that our model does show improvement over the mean absolute error of the best benchmark, the mode/median model, by half a game and by nearly a game over the positional average model.
The ADP weighted metrics again don’t fare as well as the unweighted metrics because lower-cost players see less activity, have fewer chances to get injured and are thus more predictable. But solid improvement for the SIP model over the benchmarks is still shown.
Driving factors of Injury Risk
Despite the skepticism in predicting injuries, talking heads still love to spout off supposed risk factors as if they all have meaning. The age cliff, the RB curse of 300 carries, coming off an injury-plagued season, playing for fill-in-the-blank team, Madden poster boy, contract holdouts, etc. What are some substantiated risk factors? Based on our predicted games missed model, Table 3 shows the most significant of the 300 plus tested inputs.
Table 3: Top 11 most important inputs to the games missed model

It was good to see our chance of injury model carrying a large amount of the predictive value of the inputs in the games missed model. Also, Jeremy Funk, our clinical epidemiologist, deserves another shout out for his durability and susceptibility metrics, each of which scored near the top.
Unsurprisingly, we see high impact plays and snaps on the list. But, it is noteworthy that the high impact plays were more than twice as important than simply being on the field. ADP is also on the list and is likely there due to its correlation to the point-scoring opportunities that high impact plays represent.
Notice no cumulative injury count variables showed in the top inputs here, while two time-elapsed-since-last-injury-occurrence inputs did. Time since a player’s last soft tissue injury was near the top and has appeared relevant in our past research. Enlightening to us was the fact that pedal (foot/ankle area) injuries are also so important compared to the variety of other possible body parts.
Strength to weight ratio was a throw-in metric, and we were a bit surprised to see its relative predictive value. It was meant to capture players who were “built” to withstand the beating expected in the NFL. There might be some merit to that.
Some parting words
The results from the predicted games missed model and the chance of in-season injury model suggest that injuries are not completely random and that we have models that are going to add value to your decision-making process in 2017 and beyond.
If you want to explore the 2016 test results in more detail you can use the interactive dashboard below, which shows the binned chance of in-season injury graph from earlier, as well as:
- positional breakdowns of means and medians of the actual and predicted games missed
- a complete list of player predictions, including:
- chance of in-season injury
- Predicted games missed and actual games missed with 80% and 95% confidence prediction limit references
- plotted comparisons between predicted and actual games missed with fitted regression line
- allows you to select particular player(s), position(s), or bin(s) to focus on
Fair questions will undoubtedly be raised regarding our data collection and model-building processes. Keep an eye out for articles that go into more detail on these topics and feel free to raise specific questions which you would like to see answered via the Contact Us link on our site, or via Twitter (@InjuryPredictor or @DataScientistFF). This will never be a static product. There will always be room for improvement of both our data and models, but we feel that this offers a strong start to overcoming the injury prediction hurdle.