The Danger of Relying Too Heavily on Projections

I love projections. There is something so gratifying about piecing together an expectation of a team’s pass and rush attempts, divvying the opportunity out to all the skill-position players, projecting efficiency based on some combination of prior rates and the all-important regression to the mean, and finalizing a set of hypothetical statistics that represent a legitimately feasible outcome for a given team in the coming season.
Projections are incredibly helpful. They help us test assumptions. And sitting down and going through the projected volume in an offense can bring a ton of clarity to contradictions in your rankings.
BUT -- projections can be a huge problem.
One Outcome
To do a projection right, you have to consider at least 50 different parameters.
You have a few important factors like game script, run/pass ratio and pace that help build out the total volume in the offense.
Then, for each player at each skill position, you’re answering questions like share of attempts/targets, yards per attempt/target, catch rate, and TD rate. You do this for multiple RBs, WRs and TEs. And for the backs (and some receivers), you’re concerned with both rushing and receiving rates. Whether the receiving rates inform your QB numbers or vice versa, you’re also left needing to ensure everything makes sense on the QB side.
The final result is one plausible outcome in a range. If you’ve been diligent, you can argue it’s the most likely outcome. But the odds your baseline projection has the depth charts right at each position, is allocating opportunity reasonably well, and is appropriately accounting for potential injuries is alarmingly slim. It may be the most likely outcome, but the variables that can influence a team’s season are so numerous that no outcome is particularly likely (think sub-5%).
But since we spend so much time on this baseline projection, and because we’re confident it is the most likely outcome, it’s easy to fall victim to what is known as anchoring. In this context, that means over-relying on the baseline projection. We’ve boiled down every player in the league to a single number that could feasibly represent their end-of-season fantasy point total, so the natural way to break ties while drafting is simply referring to the next highest projected player.
And therein lies the problem.
Ranges of Outcomes
The sub-5% estimation I gave above represents what I believe to be the probability a full team projection is reasonably accurate. Of course, the multitude of potential changes that could occur to the set of assumptions that projection relies on won’t impact every individual player projection. For some players, the baseline projection can be expected to stay reasonably accurate for a significant portion of the range of possibilities. Think someone like Jason Witten, who probably wouldn’t see the same type of uptick in targets others might if there was a significant injury to another pass-catcher in his offense, and also probably wouldn’t be too heavily impacted by something like a QB injury.
For others, we might be looking at a wider range. We might describe these players as boom-or-bust, recognizing both above-average upside but below-average floor. Think Allen Robinson or DeAndre Hopkins as good examples for 2017 -- players who could see a massive number of targets or cede a high percentage to other emerging options in the offense and also have displayed a wide range of efficiency over the past 2 seasons.
As drafters, we either consciously or subconsciously consider these types of ranges all the time. We generally draft these players somewhere around the middle of their ranges, recognizing their upside and downside are fairly symmetrical. One way we could represent this is as a normal distribution curve.
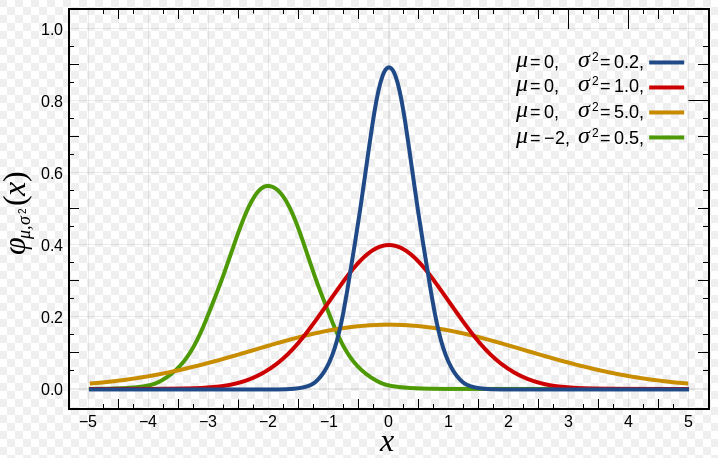
The point here is if you consider these curves as probabilities of certain outcomes occurring with the highest peaks being the highest probabilities, the most likely outcome is in the center of the range.
If we were drafting players with ranges like this, it would be totally reasonable to rely on a baseline projection.
Where This Starts to Fall Apart
Unfortunately, it’s unlikely that as many players as we’d like to imagine have a normal distribution of outcomes. Another range of outcomes to consider is one that is bimodal in shape, meaning it has more than 1 peak. It looks something like this:
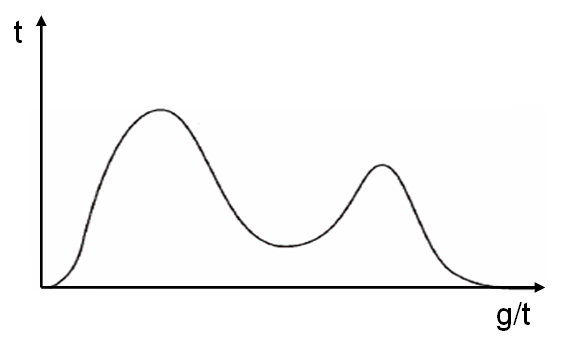
A great example of a player who might have a probability curve that resembles this is a backup RB behind a high-volume starter. Essentially, that player has a high probability of a low-value outcome and a low probability of a very high-value outcome, with an even smaller probability of something in the middle.
With projections, however, we wind up only at the most likely outcome, which generally undersells a player with a bimodal distribution. Alternatively, we could split the difference, but then we’re ending up in no-man’s land, somewhere in between the “modes” that is decidedly not the most likely outcome.
ADP generally adjusts for these types of players, though. Derrick Henry will never show out well in a baseline projection because you have to assume a lot of touches for DeMarco Murray. But his upside is inarguably tremendous.
It can be hit-or-miss, though. I’d argue a player like Darren McFadden is undervalued because there is another layer of uncertainty in his range of outcomes -- whether he’s truly the backup to Ezekiel Elliott. That makes his left “mode” (a low-value outcome) even more likely to hit, but there is still a right mode representing the possibility of a Zeke injury and McFadden assuming something close to workhorse duties in one of the best rushing offenses in football. That probably makes him a worthy late-round pick on the right roster.
The Bigger Issue
As I noted, both normal and bimodal distributions are fairly easy to adjust for. The problem is most players have distributions that are “skewed” in some way.
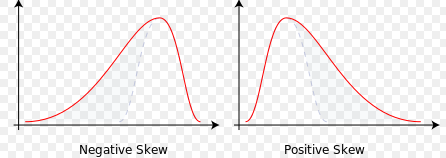
While bimodal outcomes are easy to account for, skews aren’t as clear, and thus aren’t as easy to adjust for. Many players’ most likely or baseline outcome is either very close to their ceiling or floor. Put another way, their upside and downside from that baseline are asymmetrical.
I’ll give you a couple of extreme examples.
First, consider Julian Edelman. For 4 consecutive years he’s averaged at least 9 targets per game. This season, it would be hard for him to reach that in any baseline New England projection, because the Patriots have so many options in the passing game you have to account for.
But his distribution is positively skewed (see the image above). It might only be possible to reasonably project him for 7ish targets per game, but he’s not at a substantial risk of going below that when healthy. Further, while the Patriots might look full up for targets, the probability that they remain healthy across the board at their skill positions for all 16 games is probably low. When we start stacking injury risk for each individual player on top of each other, the potential for someone to miss some time is decent. And if one or more of Patriots pass-catchers misses time, that’s exactly when Tom Brady has leaned more on Edelman in the past. In other words, there are a lot of potential outcomes where he exceeds his baseline projection.
On the flip side, consider the low-end #1 WRs like Quincy Enunwa, Tyreek Hill, or even Pierre Garcon. It’s almost impossible not to project these guys for substantial volume, simply because they play on teams with depleted depth charts at their positions. But what the baseline projections miss is fairly substantial downside.
A good test case is last year in San Francisco, where Torrey Smith’s ADP was propped up by the belief he had to have a substantial role. The risk you run with believing the baseline projection for a subpar #1 WR is that someone else can emerge -- though the 49ers didn’t acquire Jeremy Kerley until late August, he led the team in targets, receptions, and receiving yards.
Players with a lack of high-volume seasons on their track records or in new offenses where their role is unclear generally have negatively-skewed distributions. In other words, there’s more downside to their baseline than a single number can represent.
Conclusion
After making 1,600+ decisions to project each of the 32 teams, it’s easy to be bound to your results. But the truth is we should rarely make draft decisions based off a list of projections. Everything is context-dependent.
Consider the case of Darren McFadden. If you reach the double-digit rounds with 4 or 5 solid RBs, he makes sense as a player with substantial upside that you won’t need to rely on. If you implemented something like the Zero RB approach and are thin at the position, perhaps a pass-catching back with a narrow normal distribution curve makes more sense. Someone like Chris Thompson, who doesn’t have consistent 15+ point upside but can probably be counted on for a stopgap 8 points on account of his receiving role.
These are the types of considerations that should drive your draft picks, not miniscule points differences in a single set of projections. The “next best” pick by projected points isn’t going to account for what your team needs, and you shouldn’t get anchored to numbers that simply represent one outcome in a wide distribution.
We’ve given you some ideas on when you should start ignoring your rankings. And the MVP Board displays both floor and ceiling projections for every player to help you make those tough draft-day decisions.