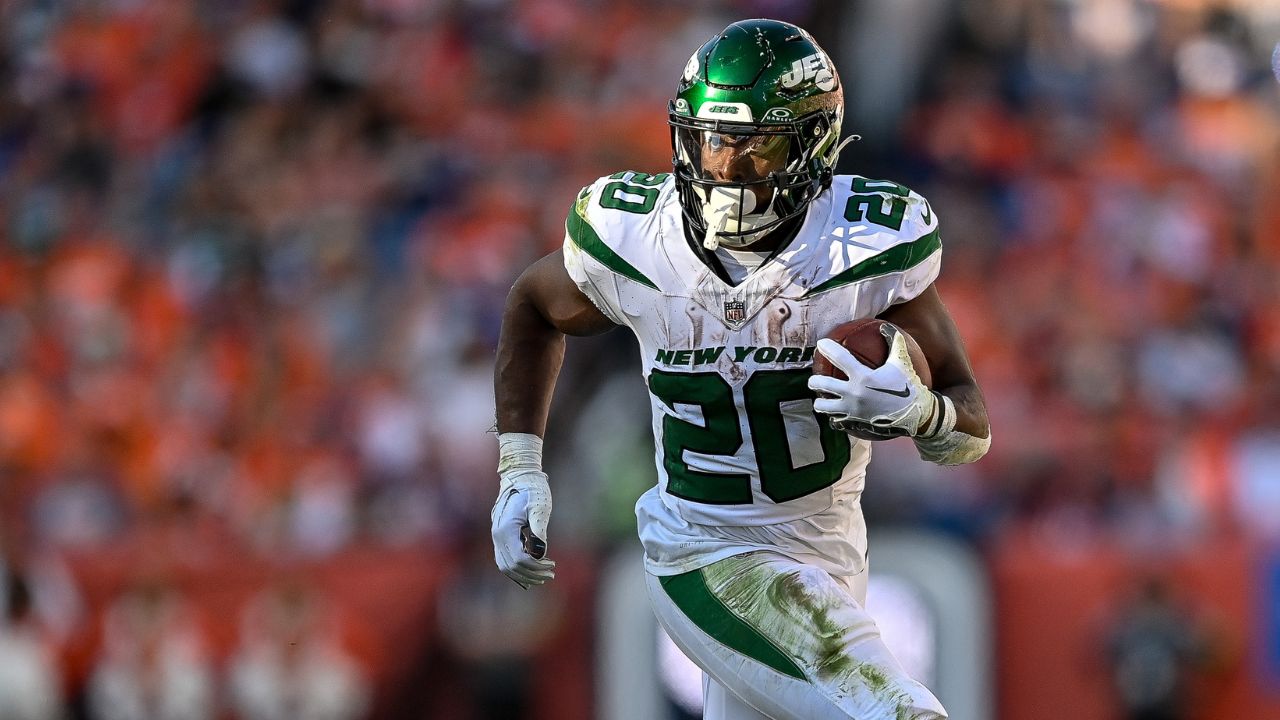
The Jets RB set a career high in rushing work last year but saw his receptions crater. Geno Smith might be the answer to restoring Hall to fantasy stardom.
The Jets RB set a career high in rushing work last year but saw his receptions crater. Geno Smith might be the answer to restoring Hall to fantasy stardom.
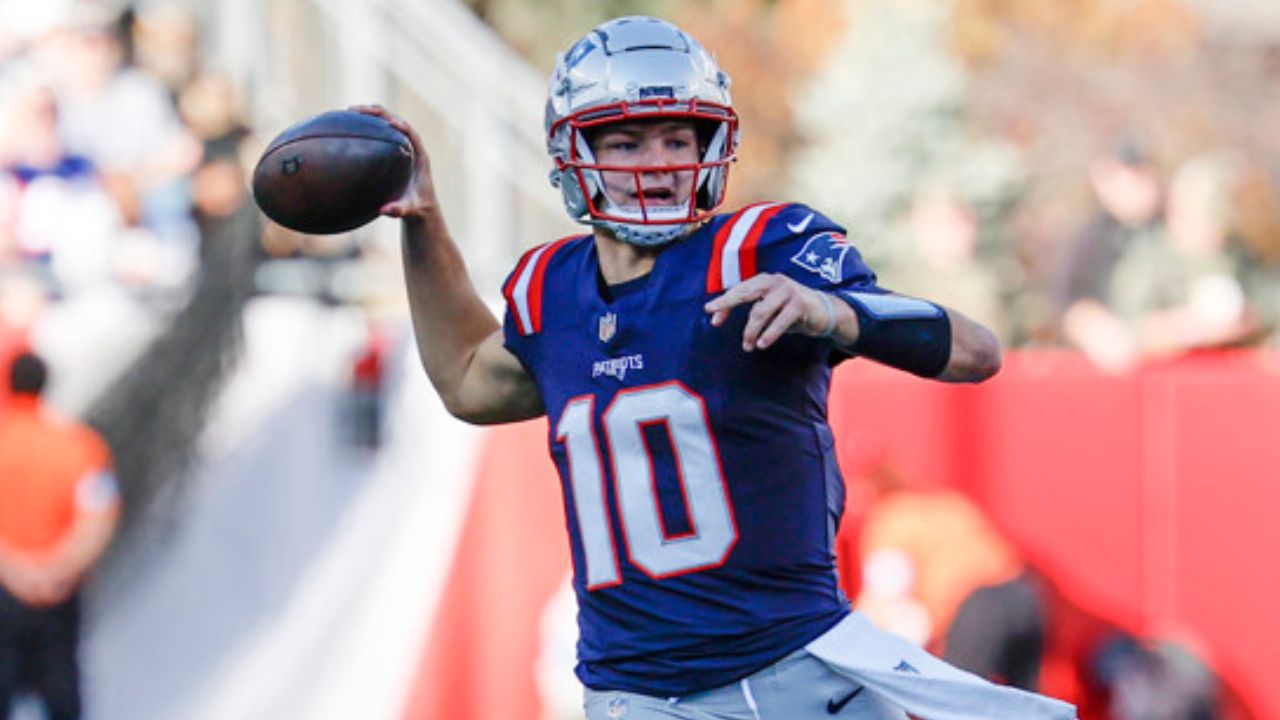
The Pats QB racked up points passing and rushing en route to the Super Bowl as an NFL sophomore. Can he knock Josh Allen from the top spot in 2026?
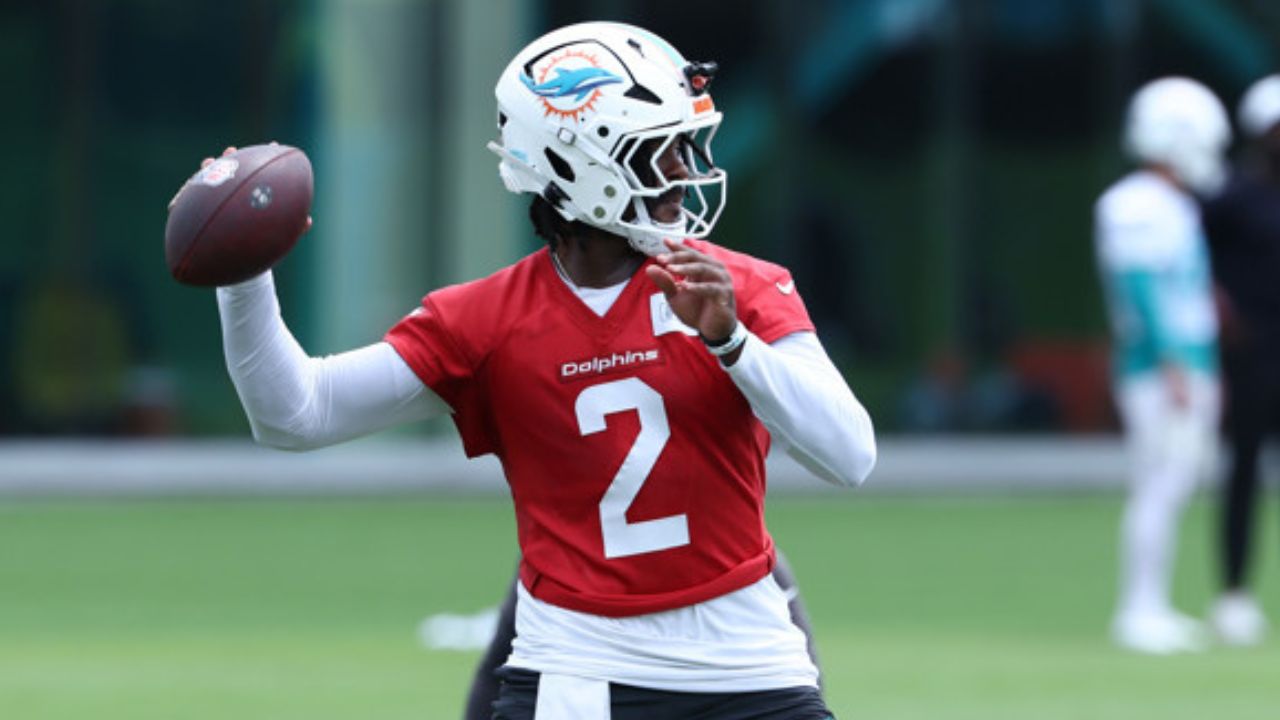
Malik Willis has a lot to prove before we can trust him to pilot a worthwhile fantasy offense in Miami. And he doesn't have a lot of help around him.
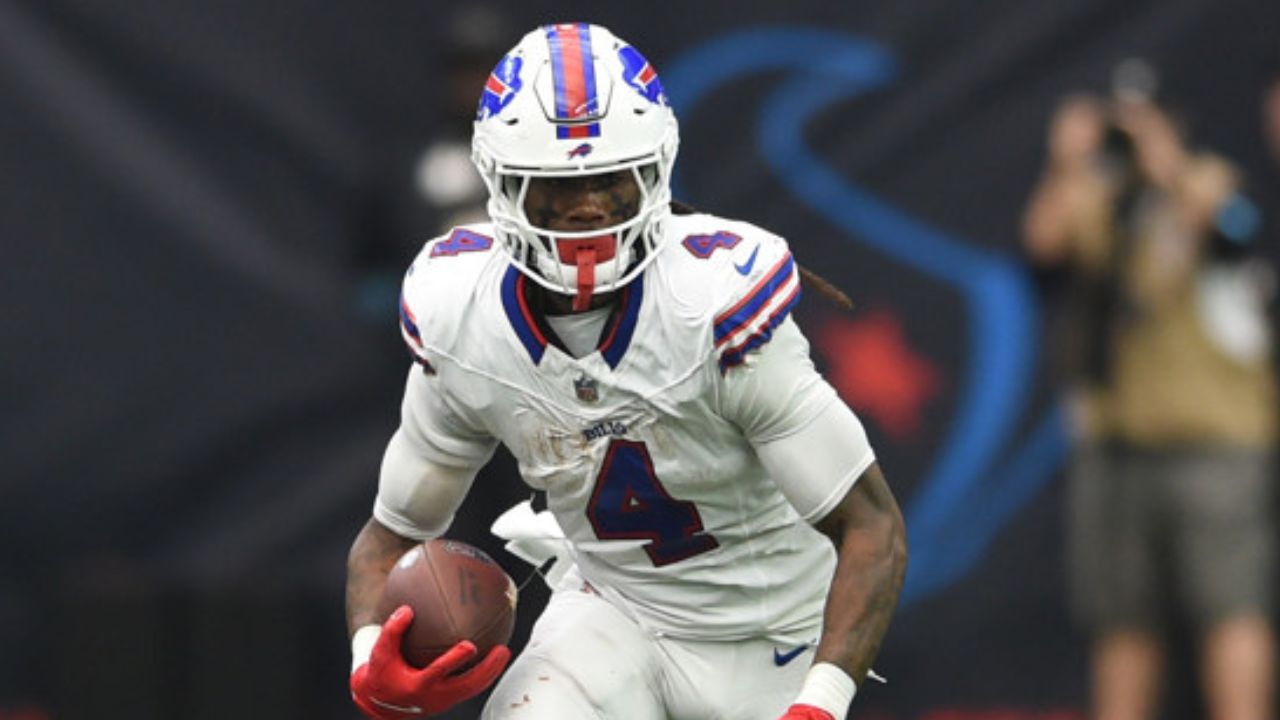
The Bills' QB and lead runner have delivered plenty of fantasy points in recent years. But does that reliability have them overpriced in this year's market?
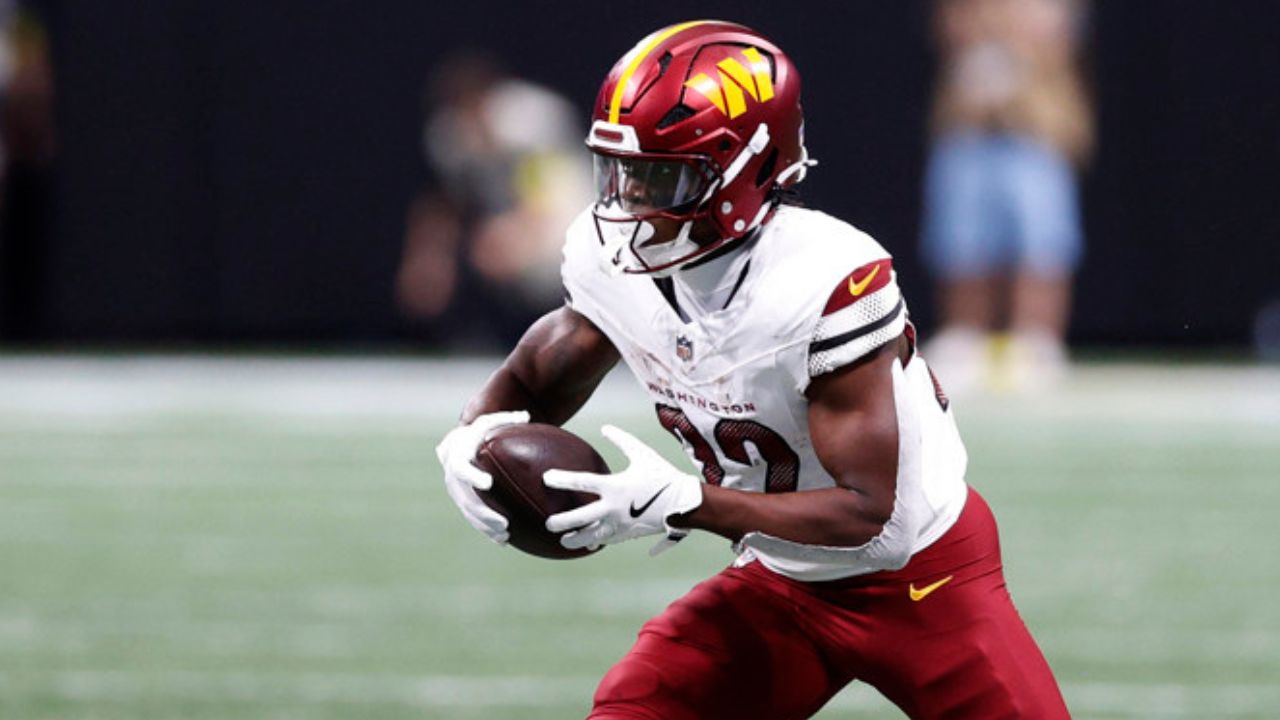
Terry McLaurin looks poised for a nice year. A muddled backfield presents draft opportunity. And a healthy Jayden Daniels is back to drive it all.
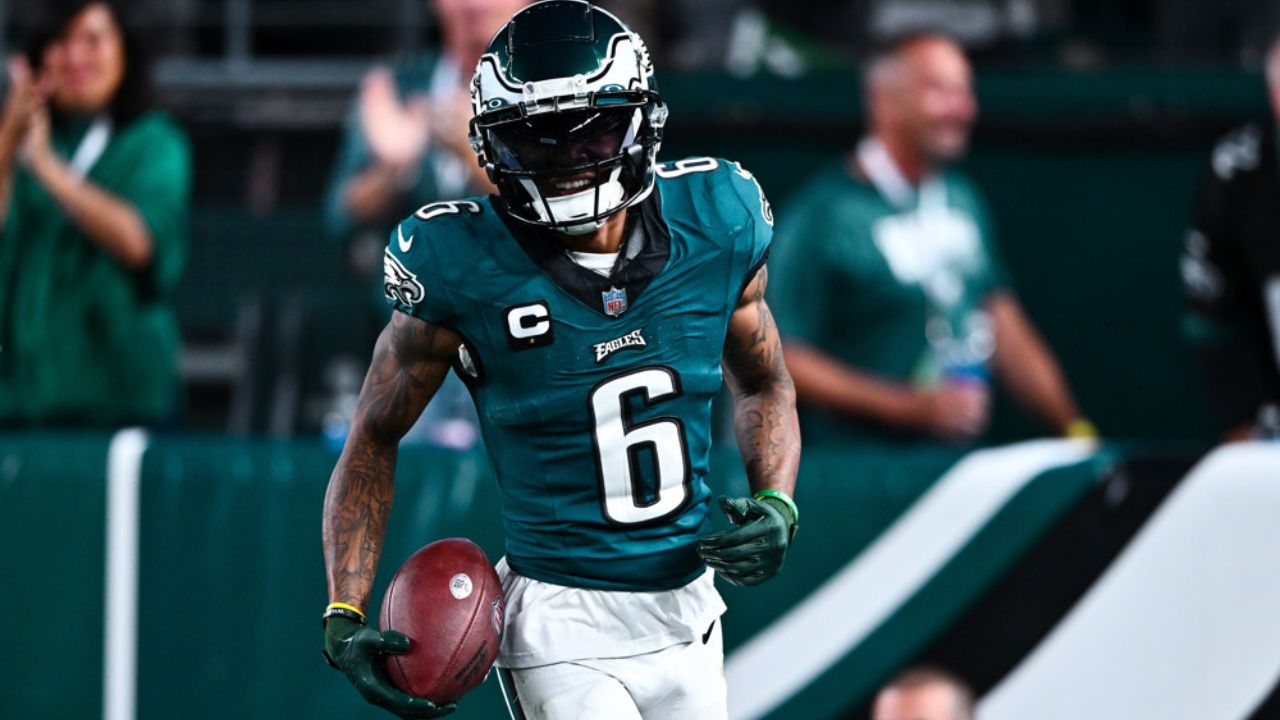
A.J. Brown's gone. The OC's gone. Will that plus the Makai Lemon pick be enough to rebound these Eagles and ignite our fantasy lineups?
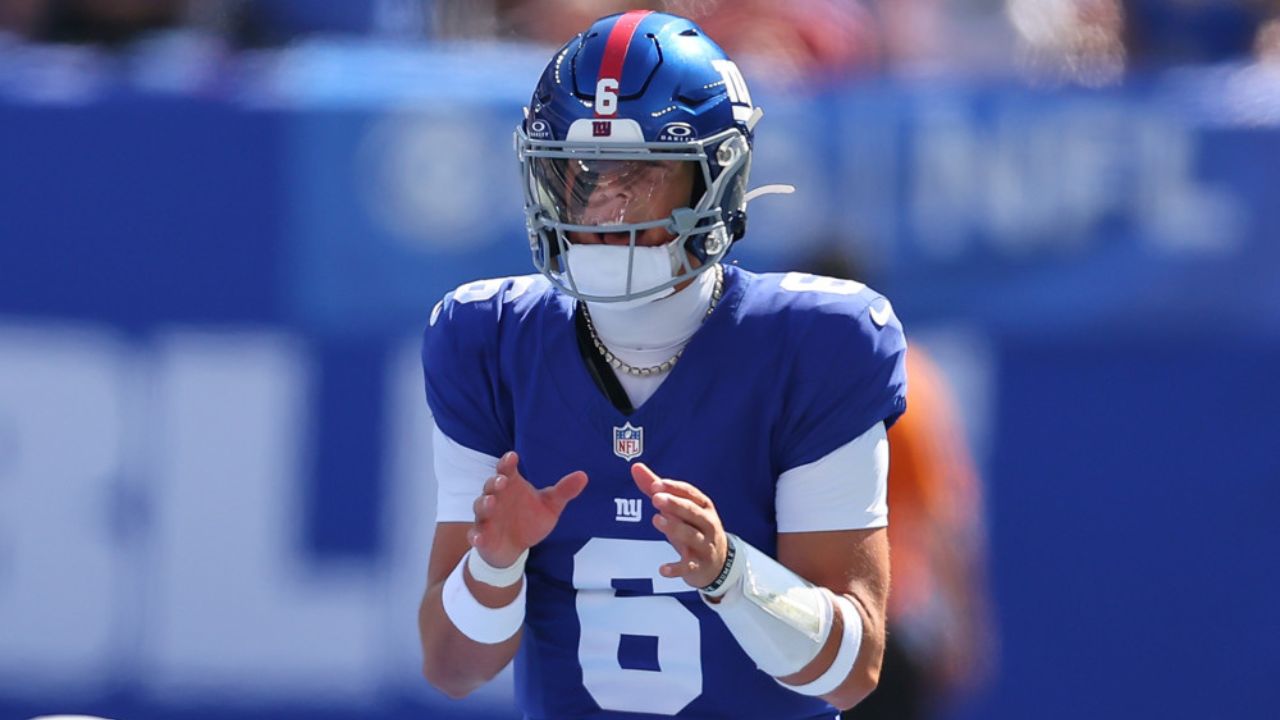
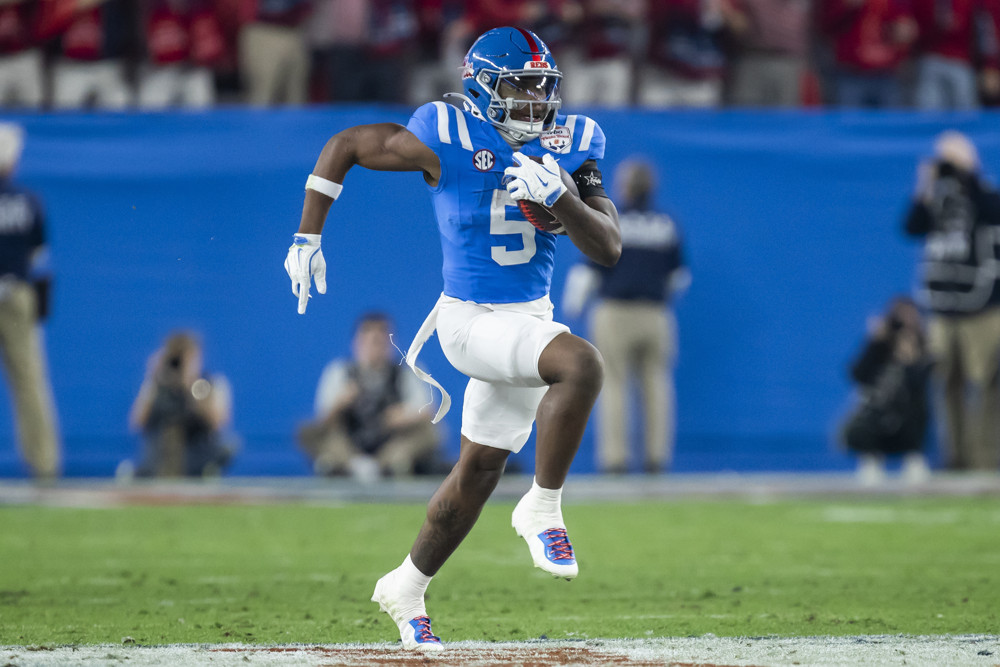
Malik Nabers, Cam Skattebo, and Jaxson Dart present exciting fantasy upside. But they also bring big questions. Should you take the leap or stay away?
 You have our personal money-back guarantee: If you’re not happy with our service for any reason, just reach out by December 31, 2026, and we’ll give you 100% of this purchase back. No strings attached. You can cancel with one-click from your account page anytime.