
Dynasty Trade Value Charts
Your Guide to Great Dynasty Trades
Dynasty fantasy football is a year-round sport. Most of the action goes down in your dynasty league between Week 17 and Week 1 (the so-called “offseason”).
NFL free agency, the NFL Draft, and even OTAs and training camps all create the need for dynasty trades.
But how do you know if a trade is going to tip the balance in your favor?
That’s where your dynasty trade value chart comes in.
The trade value chart helps you uncover trade opportunities and evaluate moves.
How does it work? Glad you asked:
Skip to: Dynasty Trade Value Chart | Redraft Trade Value Chart
What is a dynasty trade value chart?
Fantasy football trade value charts have been vital for over a decade.
But what exactly are they?
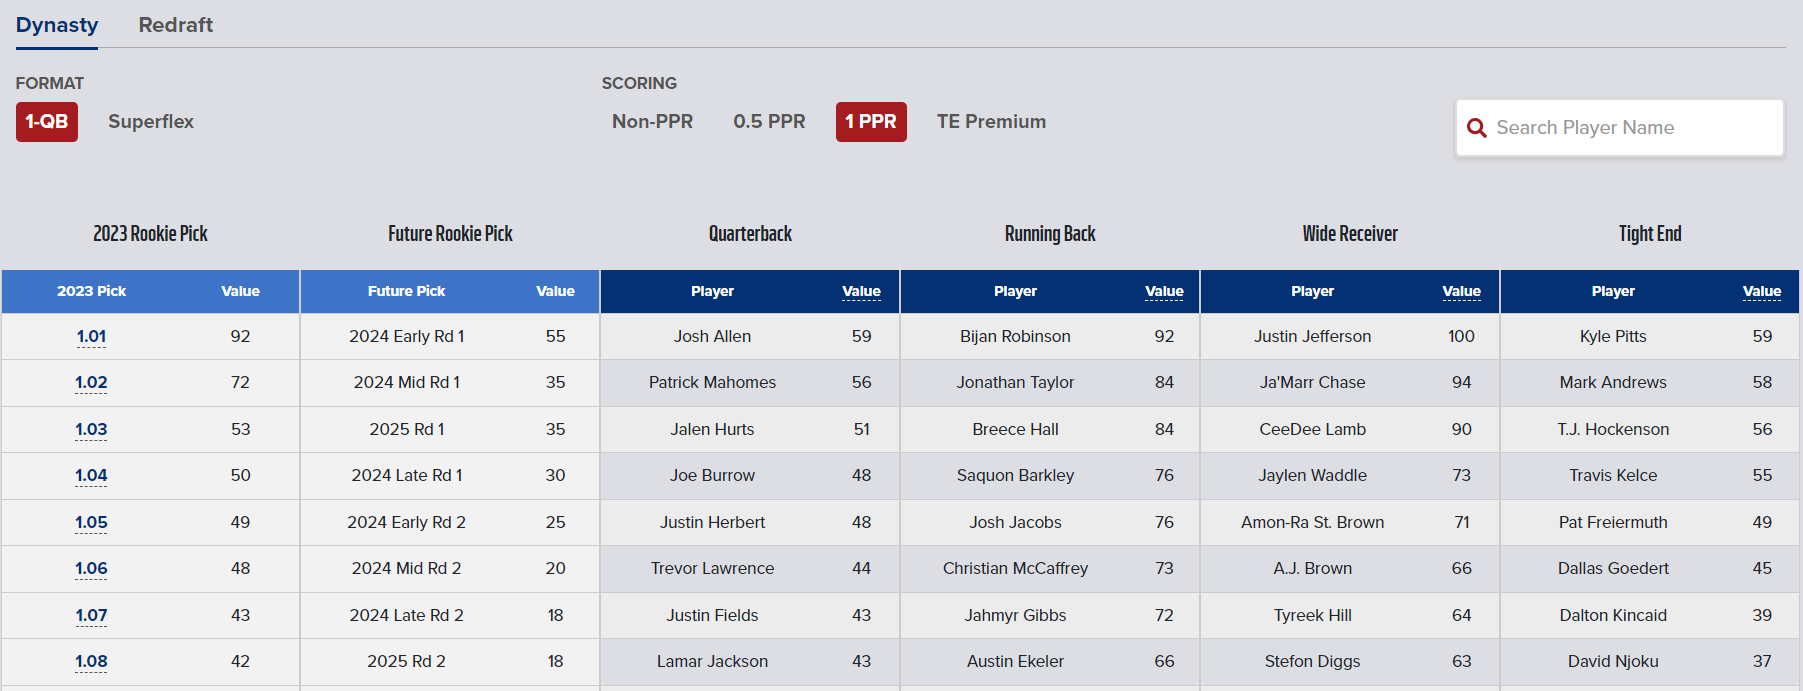
Traditionally, it’s a table that separates fantasy players by position (QB/WR/RB/TE/draft picks) and assigns each a “trade value.”
At its core, the “trade value” assigned should indicate a player's future potential and account for his past.
A player’s rest-of-season rank or scoring projection is often the backbone of that trade value.
Some trade value charts try to capture market influences as well to adjust raw performance.
How do you create a legit Trade Value Chart?
Everyone makes their chart with a different process.
Some base their values on their own ranks and a “feeling” or experience. While others generate them based on aggregate projections, ranks, or users’ trade data.
There is no right or wrong way to make a trade value chart… IF you understand the process and apply it to trading.
The Draft Sharks Way
Our dynasty trade value charts start with our award-winning projections as the foundation.
(Always good to start strong, right?)
Next, we apply machine-learning algorithms to build each player's estimated three-, five-, and 10-year projections. The algorithms use historical player data since 1999 to generate aging curves and retirement rates for players by position and player archetype.
Why 1999?
Well, the data is just better and more abundant since then. Plus, the NFL constantly changes, and we don’t want to rely on outdated trends. The models give more weight to more recent data.
The Two Key Components of a Player’s Value
We want to calculate a player's value:
- vs. a replacement-level player at his position, and
- vs. players at other positions.
These components build our 3D Value valuations.
Why is 3D Value so important?
Our 3D Value numbers power all our dynasty tools, including our dynasty trade value charts and dynasty trade calculator. Think of it as a universal number that shows you comparative value among and between players.
After years of refinement, our 3D values are the truest way to evaluate a player from a scientific and mathematical standpoint.
So that …
Our dynasty trade values represent the actual value over a replacement-level player at that position and across positions in a typical dynasty league.
We built our dynasty trade value charts on data. That limits personal bias and avoids relying on generic ranks.
Assumptions are key
Each dynasty fantasy football league is unique, and the customizable nature is a large part of the fun! But it also means you can’t just use generic rankings..
Whether you start 14 players with 5 IDPs or a more traditional 1QB + 2RB +3WR + 2Flex, you NEED to understand your dynasty format. And how your format sets player values in your league.
In our experience, the most common roster construction goes:
- 1 QB
- 2 RBs
- 2 WRs
- 1 TE
- 2 flexes
We used that as the mathematical baseline for our dynasty trade value charts.
We also assume 12 teams with a roster size of 25. We have both 1-QB and Superflex options available.
The superflex dynasty trade value chart adds one SF position to the starting lineup, bringing it to nine total.
Our TE-premium dynasty trade value chart adds 0.5 PPR to TE scoring before calculating the trade values. It is customizable to non-PPR, 0.5 PPR, and 1.0 PPR.
TIP
Is your league different? Our Draft War Room will sync directly with your league and calculate values specific to your setup.
How Do You Use a Dynasty Trade Value Chart?
It’s a simple but super powerful tool.
We can use trade value charts to look for trade targets and evaluate a trade's fairness.
Let's say you want to trade Breece Hall, and he has a value of 60 on the chart. You have plenty of RB depth and want to swap him for a WR. Look for WRs with similar values.
In this example, Drake London (61), Ladd McConkey (58), or A.J. Brown (56) would all be reasonable one-for-one trade targets.
You might need small pieces on either side to even out the trade, but the backbone is there.
It works the same for evaluating a trade request you get.
Assuming the number of pieces or players is the same (one-for-one or two-for-two). Trade value charts are excellent for simple trades. Larger deals or lopsided trades take more nuance.
In two-for-one or three-for-one trades, the side sending multiple pieces needs to pay a “trade tax.” This tax accounts for the loss in value to a single starting position and the opportunities for new players from the waiver wire.
You Have to Factor in ‘Trade Tax’
For example, you have a team with a lot of depth and want to trade some of those depth pieces for a stud like Bijan Robinson (value: 81). Offering Bucky Irving (48) and Chris Godwin (35), which equals 83, would be considered a low offer. Why? Because the team receiving Irving and Godwin would need to use two lineup spots to match the value Robinson supplies in one.
You likely have to send two players who total closer to 105-125 to get Robinson. Jonathan Taylor (51) and Amon-Ra St. Brown (64) total 115, and the trade tax would be 34 in that example (115-81). This trade still might be a little light when trading for Bijan.
The higher the player value you are trying to acquire, the higher the percentage of the trade tax.
My rule of thumb is 30-50% tax for stud players and 15-25% for starter-level players.
Negotiating the trade tax correctly can be the difference between accepting the wrong trade … or starting your dynasty.
Startup Pick Trading
Trading during the startup dynasty draft is one of the best ways to gain value early. But evaluating pick values is difficult.
We created the startup-pick trade value chart for this exact reason.
The round number is the far left column, and the headers are the corresponding picks. Want to know the value of pick 3.08? Scroll down to the fourth row (Round 3) and trace right over to pick 8.
That will get you to the trade value of that unique pick. But don’t forget the trade tax!
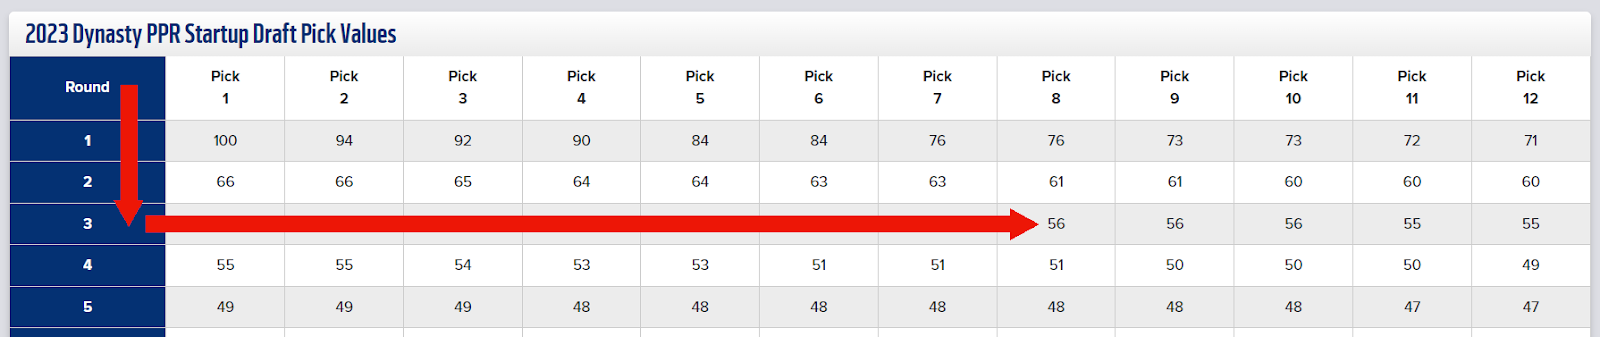
Two picks valued at 50 do not add up to 100. Remember the trade tax when evaluating 2-for-1 or 3-for-1 type trades, especially in startup drafts.
Don’t trade back if the value is not there.
Dynasty trading can be a lot of fun! But there is the potential to mess up your team for years if you don’t do it correctly – and with care.
Our dynasty trade value chart will help guide you through those decisions. Think of it as your co-pilot.
The next steps in your journey:
- Dynasty Trade Value Chart >
- Dynasty Trade Value Chart with Tight End Premium >
- Dynasty Superflex Trade Value Chart >
- Redraft Fantasy Football Trade Value Chart >
- The Draft War Room >
Keys To A Winning Dynasty Draft Strategy