2021 RB Fantasy Football Scoring Review

If Derrick Henry killed your fantasy team last year, then it’s only because he was pumping life into it before that foot fracture.
The Titans RB was delivering league-winning type of production through the 1st half of 2021. Others delivered better PPR floors, but no one was matching his ceiling.
We’ll dig further into that in a few minutes. But first, let’s pull back a little bit and look at the position as a whole last season.
Position Review
Our 2020 RB scoring review found a 2-year decline in RB fantasy scoring overall. That continued last season.
From 2010 through 2021, this is how many PPR points RBs generated per week each year:
2010: 701
2011: 694.3
2012: 672.6
2013: 693.9
2014: 695.6
2015: 705.8
2016: 706
2017: 713.1
2018: 733.2
2019: 720.7
2020: 715.1
2021: 707.1
As you can see, the position ramped up to a 2018 high point and has since some back down. Perhaps that’s more of a correction than a downturn, though, given that RBs are still scoring more than they did at the beginning of the span.
That seems to be the case if we look at RB target share by year.

The trendline heads up slightly, but we’ve really seen RB targets remain fairly constant over the past 12 years, with a 2-season spike in the middle.
Rushing work, as you might expect, has showed a clearer trend in the opposite direction.
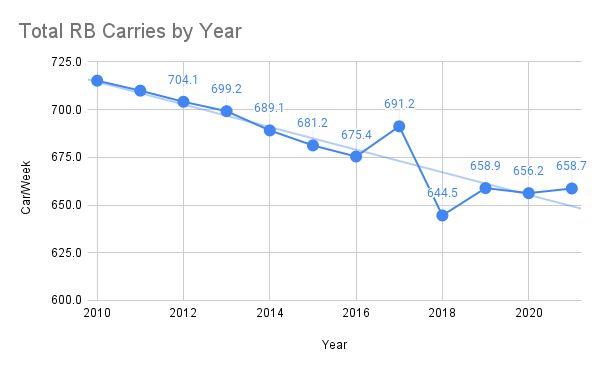
The league threw a little less and ran a little more last year. But overall, the NFL has shifted to lean much more on the pass. Other stat categories, however, indicate that teams might be figuring out how to use their RBs more efficiently.
Predictably, total rushing yards per week have trended down alongside carries per week.

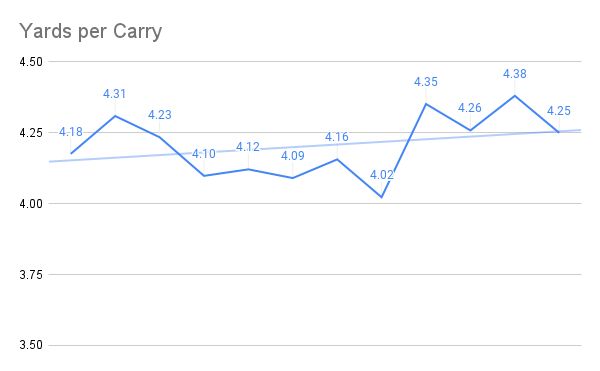
Yards per carry, however, have climbed in recent seasons.
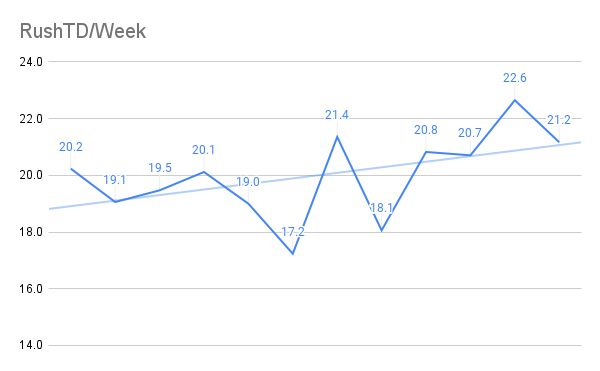
And despite fewer carries and yards, RBs are actually scoring more rushing TDs in recent seasons than they were back in the early 2010s.
We all know that the true workhorse back has been a dying breed for a while in the NFL. Let these stats highlight, though, how important it is to look at roles as we evaluate and project RBs for the coming season.
We want RBs who get targets and score TDs, and it looks like the NFL is improving at distributing those opportunities. That said, there’s certainly room for another bubble to burst and numbers to regress toward a mean. So we’ll keep tracking these by year to see where the league is headed.
For now, it’s time to refocus on the individual players.
Top Scorers
I took each week’s top 50 in RB scoring from last season and lined it up to find median scores for each spot in the rankings. The weekly RB1 scored a median of 33.9 points. So we’re using that here as the bar for RB1 finishes.
Here are the 10 players who delivered such outings:
1. Derrick Henry – 2 of 8 – 25%
2. Austin Ekeler – 2 of 16 – 12.5%
3. Jonathan Taylor – 2 of 17 – 11.8%
4T. Dalvin Cook – 1 of 13 – 7.7%
4T. Alvin Kamara – 1 of 13 – 7.7%
6T. Leonard Fournette – 1 of 14 – 7.1%
6T. Justin Jackson – 1 of 14 – 7.1%
8T. Aaron Jones – 1 of 15 – 6.7%
8T. James Conner – 1 of 15 – 6.7%
10. Cordarrelle Patterson – 1 of 16 – 6.3%
In the past, I’ve generally measured top-shelf, top-12 and top-24 weeks at the position. This year, though, I’m throwing out that lowest level.
Why?
Well, if you compare the medians for each ranking spot going down, you’ll find the largest gaps reside at the top. No. 1 checks in 4.3 PPR points ahead of #2, for example. No. 2 beats #3 by 3.45 points.
The gaps vary as you go down, but the big differences quickly disappear. For example, the difference between the median RB15 and RB16 last year was 1 PPR point. That’s larger than the gap for the 10 spots above, and it’s larger than any gap between 2 spots the rest of the way down.
What does that mean? It means we should be more interested in chasing those high scores – ahead of the early-rankings gaps – and less interested in how many times a guy finished RB17 instead of RB27.
This next list shows the guys who delivered scores of 29.6+ PPR points, which was last year’s median for top-2 level scoring. As I mentioned, the median RB2 beat the median RB3 by 3.45 points.
1. Derrick Henry – 3 of 8 – 37.5%
2. Jonathan Taylor – 3 of 17 – 17.7%
3. Leonard Fournette – 2 of 14 – 14.3%
4. James Conner – 2 of 15 – 13.3%
5T. Austin Ekeler – 2 of 16 – 12.5%
5T. Joe Mixon – 2 of 16 – 12.5%
7. Rashaad Penny – 1 of 10 – 10%
8T. Dalvin Cook – 1 of 13 – 7.7%
8T. Alvin Kamara – 1 of 13 – 7.7%
8T. Saquon Barkley – 1 of 13 7.7%
11T. Justin Jackson – 1 of 14 – 7.1%
11T. Nick Chubb – 1 of 14 – 7.1%
11T. Michael Carter – 1 of 14 – 7.1%
14. Aaron Jones – 1 of 15 – 6.7%
15. Cordarrelle Patterson – 1 of 16 – 6.3%
16T. Najee Harris – 1 of 17 – 5.9%
16T. Myles Gaskin – 1 of 17 – 5.9%
16T. Javonte Williams – 1 of 17 – 5.9%
Next is weeks of 25+ PPR points. That was a top-4 level score. The median RB4 score 2.4 more points than the median RB5.
(As we go down, of course, each list includes all of the higher-scoring games above.)
1. Derrick Henry – 4 of 8 – 50%
2. Joe Mixon – 6 of 16 – 37.5%
3. Rashaad Penny – 3 of 10 – 30%
4. Jonathan Taylor – 5 of 17 – 29.4%
5. Christian McCaffrey – 2 of 7 – 28.6%
6T. Austin Ekeler – 4 of 16 – 25%
6T. Kareem Hunt – 2 of 8 – 25%
8T. James Conner – 3 of 15 – 20%
8T. Duke Johnson – 1 of 5 – 20%
10. Najee Harris – 3 of 17 – 17.7%
11T. Alvin Kamara – 2 of 13 – 15.4%
11T. D’Andre Swift – 2 of 13 – 15.4%
13T. Leonard Fournette – 2 of 14 – 14.3%
13T. Nick Chubb – 2 of 14 – 14.3%
14. Damien Harris – 2 of 15 – 13.3%
15. Cordarrelle Patterson – 2 of 16 – 12.5%
16T. Ezekiel Elliott – 2 of 17 – 11.8%
16T. Darrel Williams – 2 of 17 – 11.8%
17. Elijah Mitchell – 1 of 11 – 9.1%
18T. Chase Edmonds – 1 of 12 – 8.3%
18T. Rhamondre Stevenson – 1 of 12 – 8.3%
20T. Dalvin Cook – 1 of 13 – 7.7%
20T. Saquon Barkley – 1 of 13 – 7.7%
20T. Jamaal Williams – 1 of 13 – 7.7%
20T. David Montgomery – 1 of 13 – 7.7%
24T. Justin Jackson – 1 of 14 – 7.1%
24T. Michael Carter – 1 of 14 – 7.1%
24T. James Robinson – 1 of 14 – 7.1%
27. Aaron Jones – 1 of 15 – 6.7%
28T. Alexander Mattison – 1 of 16 – 6.3%
28T. Rex Burkhead – 1 of 16 – 6.3%
30T. Myles Gaskin – 1 of 17 – 5.9%
30T. Javonte Williams – 1 of 17 – 5.9%
30T. Devin Singletary – 1 of 17 – 5.9%
30T. AJ Dillon – 1 of 17 – 5.9%
The players below delivered the most games of 18+ fantasy points, the median RB12 score. Though we often focus on top-12 finishes, the gaps were 0.7 or smaller for every spot from RB11 through RB15.
1. Jonathan Taylor – 12 of 17 – 70.6%
2. Austin Ekeler – 11 of 16 – 68.8%
3. Alvin Kamara – 8 of 13 – 61.5%
4. Christian McCaffrey – 4 of 7 – 57.1%
5. Derrick Henry – 4 of 8 – 50%
6. Najee Harris – 8 of 17 – 47.1%
7. James Conner – 7 of 15 – 46.7%
8. Joe Mixon – 7 of 16 – 43.8%
9T. Rashaad Penny – 4 of 10 – 40%
9T. Duke Johnson – 2 of 5 – 40%
11T. D’Andre Swift – 5 of 13 – 38.5%
11T. Dalvin Cook – 5 of 13 – 38.5%
11T. David Montgomery – 5 of 13 – 38.5%
14T. Cordarrelle Patterson – 6 of 16 – 37.5%
14T. Antonio Gibson – 6 of 16 – 37.5%
16T. Leonard Fournette – 5 of 14 – 35.7%
16T. Nick Chubb – 5 of 14 – 35.7%
16T. James Robinson – 5 of 14 – 35.7%
19. James White – 1 of 3 – 33.3%
20. Ezekiel Elliott – 5 of 17 – 29.4%
21. J.D. McKissic – 3 of 11 – 27.3%
22T. Aaron Jones – 4 of 15 – 26.7%
22T. Josh Jacobs – 4 of 15 – 26.7%
24. Kareem Hunt – 2 of 8 – 25%
25. Saquon Barkley – 3 of 13 – 23.1%
26. Clyde Edwards-Helaire – 2 of 10 – 20%
27T. Alexander Mattison – 3 of 16 – 18.8%
27T. Melvin Gordon – 3 of 16 – 18.8%
27T. Kenneth Gainwell – 3 of 16 – 18.8%
29. Elijah Mitchell – 2 of 11 – 18.2%
30T. Darrel Williams – 3 of 17 – 17.7%
30T. Myles Gaskin – 3 of 17 – 17.7%
30T. Javonte Williams – 3 of 17 – 17.7%
30T. Devin Singletary – 3 of 17 – 17.7%
30T. AJ Dillon – 3 of 17 – 17.7%
30T. D’Ernest Johnson – 3 of 17 – 17.7%
30T. Sony Michel – 3 of 17 – 17.7%
37T. Rhamondre Stevenson – 2 of 12 – 16.7%
37T. Darrell Henderson – 2 of 12 – 16.7%
39T. Michael Carter – 2 of 14 – 14.3%
39T. Mark Ingram – 1 of 7 – 14.3%
41. Damien Harris – 2 of 15 – 13.3%
42T. Boston Scott – 2 of 16 – 12.5%
42T. Devonta Freeman – 2 of 16 – 12.5%
42T. Dontrell Hilliard – 1 of 8 – 12.5%
45T. Khalil Herbert – 2 of 17 – 11.8%
45T. Brandon Bolden – 2 of 17 – 11.8%
(22 more with 1 such game)
Finally, 16.9 turned up as the median RB15 score – 1.0 ahead of the RB16. So we’ll use that as our final cutoff. Only 7 RBs reached that level in at least half of their games.
1. Jonathan Taylor – 13 of 17 – 76.5%
2. Austin Ekeler – 11 of 16 – 68.75%
3. Derrick Henry – 5 of 8 – 62.5%
4. Alvin Kamara – 8 of 13 – 61.5%
5. Najee Harris – 10 of 17 – 58.8%
6T. Christian McCaffrey – 4 of 7 – 57.1%
6T. Leonard Fournette – 8 of 14 – 57.1%
8. Ezekiel Elliott – 8 of 17 – 47.1%
9. James Conner – 7 of 15 – 46.7%
10. D’Andre Swift – 6 of 13 – 46.2%
11. J.D. McKissic – 5 of 11 – 45.5%
12T. Joe Mixon – 7 of 16 – 43.75%
12T. Antonio Gibson – 7 of 16 – 43.75%
14. James Robinson – 6 of 14 – 42.9%
15T. Rashaad Penny – 4 of 10 – 40%
15T. Duke Johnson – 2 of 5 – 40%
15T. Damien Harris – 6 of 15 – 40%
18T. Dalvin Cook – 5 of 13 – 38.5%
18T. David Montgomery – 5 of 13 – 38.5%
20. Cordarrelle Patterson – 6 of 16 – 37.5%
21. Nick Chubb – 5 of 14 – 35.7%
22T. James White – 1 of 3 – 33.3%
22T. Aaron Jones – 5 of 15 – 33.3%
22T. Josh Jacobs – 5 of 15 – 33.3%
22T. Darrell Henderson – 4 of 12 – 33.3%
26. Melvin Gordon – 5 of 16 – 31.3%
27. Clyde Edwards-Helaire – 3 of 10 – 30%
28. Elijah Mitchell – 3 of 11 – 27.3%
29. Kareem Hunt – 2 of 8 – 25%
30T. Darrel Williams – 4 of 17 – 23.5%
30T. Myles Gaskin – 4 of 17 – 23.5%
30T. Javonte Williams – 4 of 17 – 23.5%
30T. Devin Singletary – 4 of 17 – 23.5%
30T. AJ Dillon – 4 of 17 – 23.5%
35. Saquon Barkley – 3 of 13 – 23.1%
36. Michael Carter – 3 of 14 – 21.4%
37T. Alexander Mattison – 3 of 16 – 18.75%
37T. Kenneth Gainwell – 3 of 16 – 18.75%
39T. D’Ernest Johnson – 3 of 17 – 17.7%
39T. Sony Michel – 3 of 17 – 17.7%
41T. Rhamondre Stevenson – 2 of 12 – 16.7%
41T. Chase Edmonds – 2 of 12 – 16.7%
43T. Mark Ingram – 1 of 7 – 14.3%
43T. Jordan Howard – 1 of 7 – 14.3%
45T. Boston Scott – 2 of 16 – 12.5%
45T. Devonta Freeman – 2 of 16 – 12.5%
45T. Devontae Booker – 2 of 16 – 12.5%
45T. Ty Johnson – 2 of 16 – 12.5%
45T. Dontrell Hilliard – 1 of 8 – 12.5%
50T. Khalil Herbert – 2 of 17 – 11.8%
50T. Brandon Bolden – 2 of 17 – 11.8%
(23 more with 1 such game)
Team RB Weeks
Although our primary focus here is on individual players, we’re obviously also interested in good situations. So here are all the RB weeks counted above, tallied by team and sorted by most weeks of 16.9+ points.

Washington and New England stand out here more than their individual pieces did in the player lists.
Did they just find good fortune in 2021? Or are these backfields you might avoid early before targeting pieces in the middle-to-later rounds?
Check our 2022 RB rankings and create your Draft War Room to get that answered by situation.